Twenty-Two Billion Tokens Through a Refusal-Free Endpoint

Search for the term this page ranks for and you will find a Hugging Face adapter, three GitHub recipes, two blogs arguing about whether hosted abliteration is real, and a directory of uncensored model files.
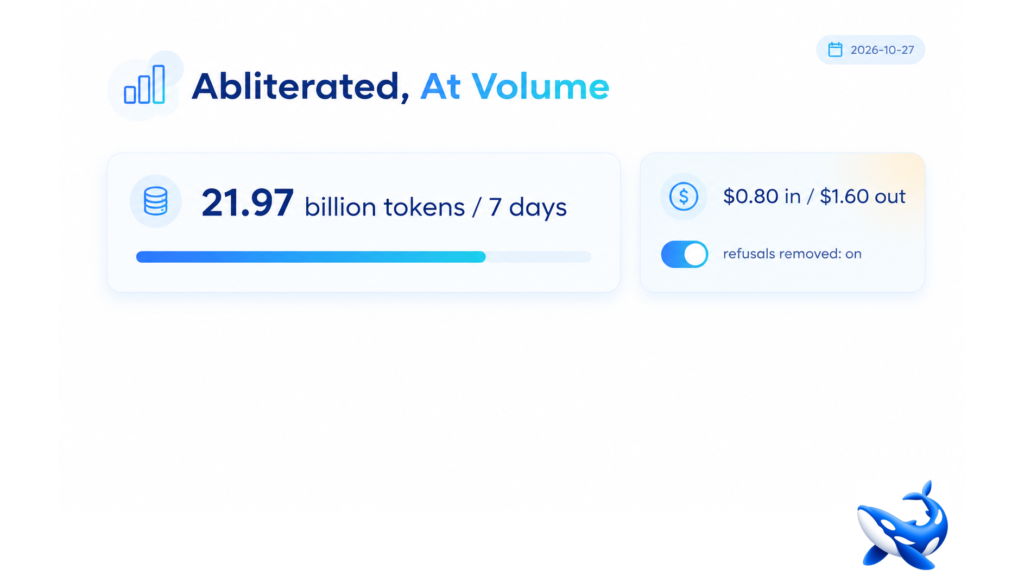
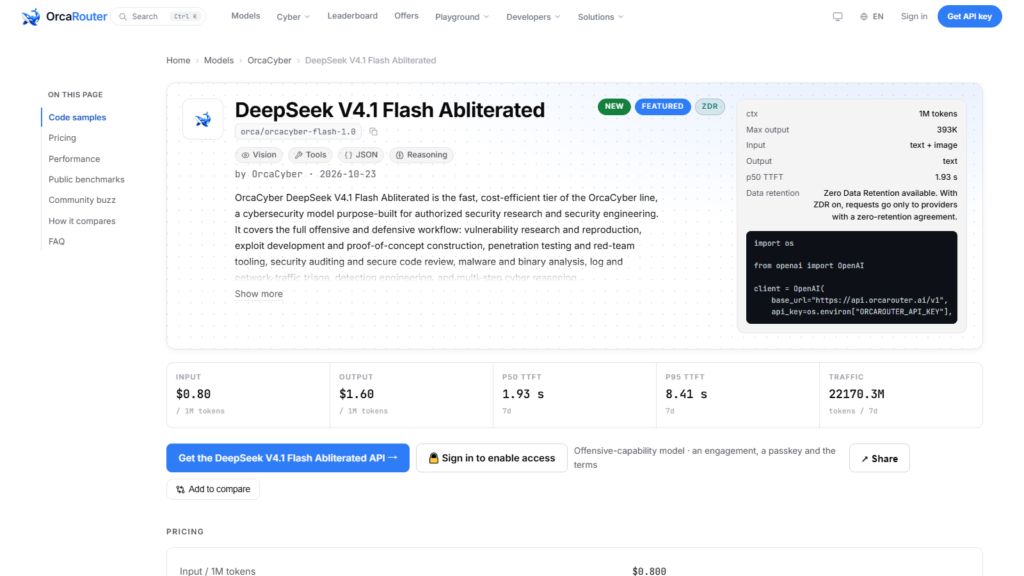
What you will not find is a single number describing what an abliterated endpoint actually carries in production. Through OrcaRouter you reach the DeepSeek V4.1 Flash abliterated card on the same key as the rest of the catalogue, and it did 21,973,601,115 tokens in seven days, at $0.80 input and $1.60 output per million with a p50 first token of 1.94 seconds [OURS]. Released 2026-10-23, it is the second-busiest card in the OrcaCyber line and the busiest of the two flash-tier cards.
That volume matters because it answers the question the rest of the SERP leaves open. Abliteration guides tell you how to strip refusal behaviour from a checkpoint. Using AI to Break Down Difficult Verification posts tell you that self-reported “uncensored” claims are hard to check. Neither tells you whether anyone runs the result at scale, what it costs when they do, or how much slower a refusal-free model is than the base checkpoint it came from.
What the number actually measures
Twenty-one point nine seven billion tokens is one week of traffic through one card on one gateway. It is not the model’s global usage — nobody publishes that for an abliterated build and it is not a download count. It is the tokens that passed through a hosted, OpenAI-compatible endpoint between 2026-10-19 and 2026-10-26.
For scale inside the same catalogue: the base DeepSeek V4.1 Flash alias moved about a thousand times more (22.12 trillion) in the same window [OURS]. The abliterated tier is not competing with the base model for volume and should not. It is competing for a specific slice of work that the base model declines.
Three numbers that are not benchmarks
The reason to quote production telemetry instead of a leaderboard is that abliteration is a fine-tuning operation and fine-tuning changes serving behaviour in ways bench scores do not capture.
| Metric (7 days) | Value |
| p50 time to first token | 1,940 ms |
| p95 time to first token | 8,419 ms |
| Output throughput | 138.8 tok/s |
| Error rate | 0.26% |
A p95 of 8.4 seconds against a p50 of 1.9 is a long tail — roughly four times the median — and that shape is typical of a model whose requests vary wildly in length. Security work does exactly that: a two-line question about a CVE and a whole-repository audit arrive through the same endpoint. If your client uses a fixed 30-second timeout, the p95 is what you plan around, not the p50.
Throughput of 138.8 tokens per second is the number that decides whether an interactive workflow feels usable. For comparison, the cheapest card in this batch runs at 199.2 tok/s and the OrcaCyber flagship at 42.2 [OURS]. Abliteration does not cost you speed here; it costs you price.
The price of removing refusals
The base checkpoint is $0.15 in and $0.60 out. This card is $0.80 and $1.60. That is 5.33× on input and 2.67× on output, or 3.81× blended at a typical 3:1 input-to-output mix [OURS].
Two things follow. First, the premium is not uniform: the input multiple is twice the output multiple, so long-context, read-heavy work pays the most. Second, at these absolute numbers the premium is still small. A million input tokens costs eighty cents. The decision is not “can I afford this” but “is the refusal-free behaviour actually required for this task”, because for anything the base model answers correctly, you are paying five times more for the same output.
Cache reads are priced at $0.15 per million — eighteen point seven five percent of the input rate, or a 5.3× discount on repeated prefixes [OURS]. That is the least generous cache ratio in this batch, where DeepSeek prices cache at two percent of input. If your workload reuses a large system prompt, that difference is worth modelling before you commit.
What the benchmark rows say, and what they do not
OrcaCyber’s own published rows for this card are: CyberGym 88.1, SEC-Bench Pro 62.8, Terminal-Bench 2.1 90.6, DeepSWE v1.1 74.2, GPQA Diamond 90.9, and ExploitGym 15.3 [VENDOR].
Read those as a set rather than one at a time. GPQA Diamond and Terminal-Bench 2.1 are general capability measures — graduate-level science reasoning and terminal work — and abliteration does not touch them, because neither benchmark depends on the model declining. CyberGym and SEC-Bench Pro are security-specific. ExploitGym at 15.3 is the interesting one: it is the only row on the card that measures exploit construction, and it is low enough that no general-purpose model would publish it voluntarily.
That last row is the honest signal in the table. A card that publishes 90.9 next to 15.3 is telling you where the model is strong and where it is not, which is more than most launch pages do.
Who this is for
Authorized security work — vulnerability research and reproduction, exploit development against your own targets, penetration testing with a signed scope, malware and binary analysis, detection engineering. The refusal-free property exists because those tasks routinely trip safety filters on general assistants, not because the model is meant for arbitrary use. Access runs through OrcaCyber’s offensive-capability gate — an engagement, a passkey and acceptance of the terms — before any request is served [OURS].
If you are building a pipeline around it, three practical notes. The output ceiling is 393,216 tokens, so a complete audit report fits in one call without stitching. The context window is 1,048,576 tokens, which is enough for a whole repository or a large packet capture. And it accepts images as well as text, which is what the next article in this set is about.
How to get your own version of this number
The figure at the top of this article is ours, not yours, and the only version that should influence your budget is the one you measure. The good news is that a representative week costs very little to produce.
Start by sampling your real traffic rather than inventing prompts. A few hundred logged requests, drawn across a normal week and including the awkward ones, will tell you more than any synthetic suite. Strip anything you cannot send to a third party, then replay the rest against the base checkpoint and against the abliterated card.
Record four things per request: whether the base model refused, whether the abliterated model refused, the input and output token counts the provider reports, and the wall-clock time from request to final token. Four columns are enough.
The refusal rate is the number that decides everything else. If the base model refused two percent of your sample, the abliterated tier is an expensive way to solve a small problem, and a retry branch plus a fallback model is probably cheaper. If it refused thirty percent, you are already paying for those refusals twice — once in tokens that produced nothing, and again in the retry — and the price analysis inverts.
The token columns tell you where the money goes. In security work the input usually dwarfs the output, often by an order of magnitude, which is why the input multiple matters more than the output multiple. If your own sample shows the opposite — a short prompt and a very long artifact — then the output rate is what you should be comparing, and the picture changes.
The timing column is the one teams forget. A model that answers in two seconds and a model that answers in twenty can have identical prices and completely different products. Our p95 of 8.4 seconds against a p50 of 1.9 is the shape you are looking for: it tells you how much of your traffic will hit a long tail, and therefore how long your timeout has to be before the retry logic stops being the bottleneck.
Run this once, keep the sheet, and re-run it whenever the provider changes a rate or a checkpoint. The numbers move, and a budget built on last quarter’s refusal rate is a budget built on a guess.
The takeaway
The abliterated-tier question has moved on from “is it real” to “what does it cost to run”. On this card the answer is $0.80 and $1.60 per million, a 3.81× blended premium over the base checkpoint, 138.8 tokens per second, and a p95 first token near eight and a half seconds. Twenty-two billion tokens went through it in a week on our gateway, which is evidence that the demand the SERP keeps discussing is not hypothetical.
Sourcing note: pricing, latency, traffic and context figures are OrcaRouter production telemetry for the seven days ending 2026-10-26 [OURS]. Benchmark rows are OrcaCyber’s own published claims and have not been independently reproduced [VENDOR]. Release date and model capabilities come from the model page, checked 2026-10-27. No third-party benchmark figures are used in this article.